A Closer Look: FairlawnGig, ECFiber, and Municipal Broadband Financing “Models”
Key Takeaways
- A recent webinar on financing municipal broadband networks glossed over essential points and focused on creating a palatable – and, arguably, overly simplistic – narrative about municipal broadband for local officials.
- Deeper analysis of the two “model” municipal broadband systems covered in the webinar reveals a much more nuanced reality than the one offered by the discussants.
- In the case of one “model” system, FairlawnGig, by the time the city of Fairlawn pays off its debts owns the network, it will have used more than $20 million in taxpayer funds to purchase the $10 million network. In the case of the other, ECFiber, the system appears to be an outlier among Vermont’s CUDs, which are heavily subsidized by $200+ million in ARPA funding.
- In short, the webinar offered highly curated narratives about two purported “model” systems, reflecting a common dynamic among municipal broadband supporters, who typically cherry-pick the sources, data, and information presented to local officials.
- Rather than take these narratives as gospel truth, public officials should endeavor to have all information available to them as they make broadband-related decisions.
Recently, the American Association for Public Broadband (AAPB) and Institute for Local Self-Reliance (ILSR)’s Community Broadband Networks Initiative hosted “an hour-long deep dive into the financing of publicly-owned, locally-controlled broadband networks.” The goal of this discussion was to provide attendees with “an inside look at how successful community broadband networks have been funded – and how cities and towns can still finance networks even with the uncertainty now swirling around the federal BEAD program.”
Neither the discussion nor the press accounts of the event made any effort to dig deeper into the details of the municipal broadband projects profiled: ECFiber in rural Vermont and FairlawnGig in Fairlawn, OH. Instead, the discussion glossed over essential points and focused on creating a palatable – and, arguably, overly simplistic – narrative about municipal broadband for local officials so that they will be “more comfortable with how they can move forward [with muni broadband projects].”
The following seeks to fill in these information and data gaps for FairlawnGig and ECFiber.
What’s Really Happening With FairlawnGig
FairlawnGig owes its existence to a conduit financing arrangement with Summit County’s Development Finance Authority (DFA). In 2016, the DFA issued $10.1M in tax-exempt bonds to finance the broadband network. Accordingly, DFA, not Fairlawn, owns the fiber network. Indeed, Fairlawn leases access on the DFA-owned fiber network. Once that debt is retired, which is estimated to be in 2046, the city will own the network.
In the ILSR/AAPB webinar, a representative from FairlawnGig made it seem like the city currently owns the infrastructure outright. That is technically false. The representative also mentioned that the city is paying down the system’s debt out of its general fund. This is true and is a major point that was not fully explored during the discussion.
The conduit financing arrangement shifts all the risk for repayment of the bond from the DFA to Fairlawn. Fairlawn’s lease payments to the DFA are indeed sourced from the city’s general fund. This means that the city of Fairlawn and its taxpayers are ultimately on the hook for any struggles or failures that the muni fiber system encounters.
The FairlawnGig representative also stated that, in its first year, the network “basically broke even” and, since then, the network has “gone well past that,” indicating that the network is operating well into the black (i.e., operating revenues outpace expenses). Based on the city’s own audited financials, this does not appear to be entirely accurate.
The following table tracks FairlawnGig’s operating revenues, operating expenses, and net income. The net income figure can be misleading because, in Fairlawn’s case, its operating expenses include depreciation costs, which reflect the age of the network and not actual losses. Even so, net income can be a useful metric of the extent to which a system might be struggling to break even, or if it is generating far more revenues than expenses, including depreciation.
The table also tracks (1) transfers from the city’s general fund to FairlawnGig to prop up the system and (2) how much the city has paid from its general fund to cover FairlawnGig’s lease payments to DFA (the FairlawnGig representative stated on several occasions that the city chose early on to cover these costs in this manner). These figures highlight just how much Fairlawn has subsidized its fiber network – an aspect of this project that was not mentioned or examined during the webinar.
| Year | Operating Revenue | Operating Expenses | Net Income | General Fund Transfers to FairlawnGig | General Funds Used to Cover Lease Payments | Total City Subsidy for FairlawnGig |
|---|---|---|---|---|---|---|
| 2016 | $9,796 | $217,113 | -$207,317 | $437,829 | $198,730 | $636,559 |
| 2017 | $584,540 | $1,712,089 | -$1,127,549 | $1,705,527 | $586,650 | $2,292,177 |
| 2018 | $1,500,438 | $2,361,920 | -$861,482 | $482,000 | $584,500 | $1,066,500 |
| 2019 | $2,032,437 | $2,838,853 | -$806,416 | $180,000 | $587,350 | $767,350 |
| 2020 | $2,240,162 | $3,221,015 | -$980,853 | $0 | $582,950 | $582,950 |
| 2021 | $2,901,919 | $3,222,700 | -$320,781 | $0 | $583,550 | $583,550 |
| 2022 | $3,227,123 | $3,053,093 | $174,030 | $0 | $584,0501 | $584,050 |
| 2023 | $3,233,599 | $3,390,980 | -$157,381 | $0 | $580,1502 | $580,159 |
| Cumulative | - | - | - | $2,805,536 | $4,287,759 | $7,093,295 |
Based on the preceding table, Fairlawn has subsidized its municipal broadband network with $7 million of taxpayer funds to date. That figure will grow further as the city continues to pay FairlawnGig’s annual lease payments to DFA. The remaining lease payments at the end of 2023 totaled $13,291,450. This means that, by the time the city of Fairlawn pays off its debts to the DFA and owns its municipal fiber system, it will have used more than $20 million in taxpayer funds to purchase this $10 million network. It is unlikely that many other cities have the capacity or appetite to engage in a similar subsidization arrangement.
What’s Really Happening With ECFiber and Other CUDs in Vermont
During the webinar, a representative from ECFiber discussed the entity’s leading role in creating Communications Utility Districts (CUDs) in Vermont. CUDs are special purpose municipal entities comprised of two or more towns that partner to build broadband infrastructure. State law empowers these entities to issue debt in support of broadband projects; however, as discussed during the webinar, those bonds must be backed by broadband revenues, not the general funds of member towns.
ECFiber’s financial performance has been relatively consistent in recent years, with revenues exceeding expenses. This is to be expected, though, given the strictures of Vermont’s CUD law, which forces these entities to self-sustain without any backstop other than the revenues derived from their broadband system. Accordingly, one would expect all other CUDs to be performing on par with ECFiber; otherwise, they would be out of business. And yet, ECFiber is the only one of the state’s 9 CUDs that has received a bond rating. (It should be noted that ECFiber’s rating from S&P Global is BB, which is classified as “speculative” and reflects “major ongoing uncertainties to adverse business, financial and economic conditions.”)
Are the other CUDs performing as well as ECFiber?
The environment in which CUDs are currently operating is different than when ECFiber was created. In particular, Vermont has chosen to heavily subsidize CUDs’ fiber deployments by leveraging $200M+ in ARPA funds. Grantees typically book grants as revenue, even though those funds can only be used for capital expenditures (i.e., building networks). Even so, this accounting dynamic skews CUDs’ balance sheets.
For example, DVFiber, another CUD in the state, has received $27M+ in construction grants from the state and another $5M+ in pre-construction grants. On its balance sheet, these grants help give the appearance that DVFiber is operating in the black:
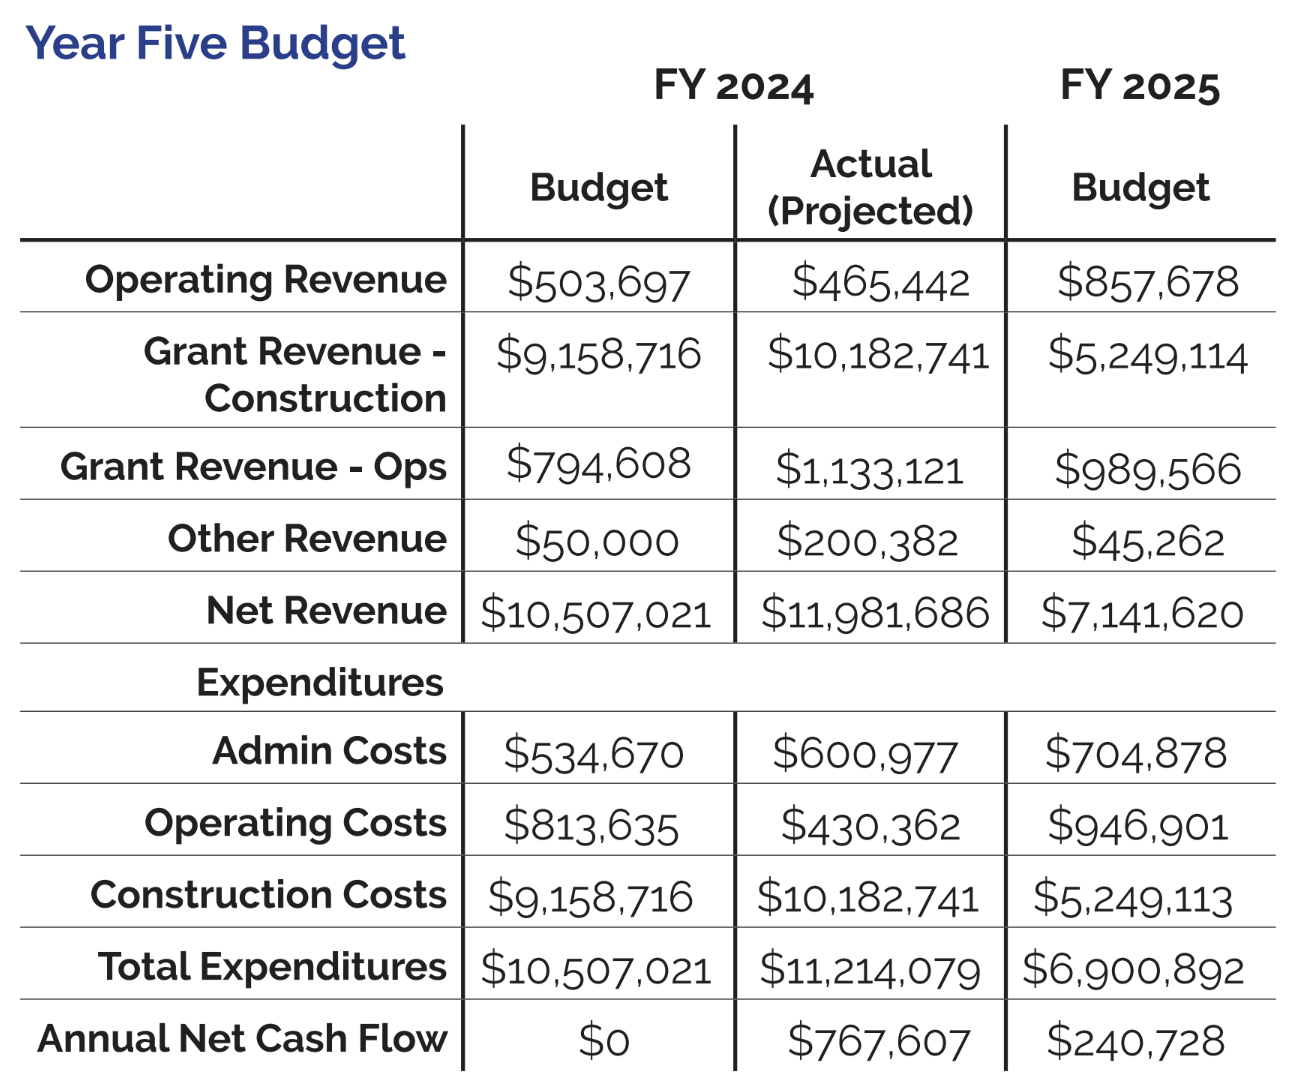
However, if the grant funds are removed from the balance sheet, the CUD’s financials change dramatically. Its revenues in 2024 – $465,442 (operating) + $200,382 (other) – are much less than its expenses – $600,977 (admin costs) + $430,362 (operating costs) – yielding negative net income of -$365,515.
This dynamic is evident for all other CUDs in the state: Maple Broadband, Chittenden County, NEK Broadband, Lamoille Fibernet, Northwest Fiberworx, and Southern Vermont (Otter Creek CUD is still in its early stages).
Given their reliance on state funding to support deployment, it is unclear whether these CUDs will have the wherewithal to self-sustain like ECFiber, which had little choice to do so because of its debt repayment obligations. Unlike bonds, state grants do not have to be repaid. In short, ECFiber might be an outlier among Vermont’s CUDs.
It should also be noted that ILSR and AAPB appear to be supportive of the CUD law in Vermont, which permits municipal broadband via multi-city partnerships only if very specific criteria are met (e.g., no use of city taxpayer funds; the CUD must self-sustain; etc.) and subject to a host of robust governance, transparency, and accountability requirements. ILSR and AAPB, however, have advocated against similarly comprehensive laws in other states that have sought to manage muni broadband decision-making at the local level.
Takeaways
The narrative provided by the ILSR/AAPB webinar is highly curated and contains only those pieces of information about the chosen “model” muni broadband systems – FairlawnGig and ECFiber – that fit its narrative. The preceding analysis provides additional context and information about these systems so that local officials and others who might rely on these “models” have all the data needed to make informed decisions about whether a particular deployment approach or financing arrangement makes sense.
Going forward, local officials should endeavor to have all information available to them as they make broadband-related decisions. The ILSR/AAPB webinar offers an illustrative case study of how those who promote municipal broadband – advocacy groups, consultants, and others – typically cherry-pick the sources, data, and information presented to local officials who are curious about these projects. The ACLP strives to provide local officials and other stakeholders with the full picture of muni broadband – the good, the bad, and the ugly.