| Distance | Locations | Already served | Served or BEAD-funded |
|---|---|---|---|
| 1 mile | 92,737 | 89.5% | 92.5% |
| 3 miles | 129,023 | 87.4% | 90.4% |
| 5 miles | 149,024 | 86.8% | 89.5% |
| 10 miles | 183,250 | 85.8% | 88.4% |
Most Locations Along Colorado’s Proposed Middle-Mile Corridors Already Have Service
middle-mile
BEAD
Colorado
Colorado’s draft middle-mile plan proposes new fiber along highway corridors in three western regions. Within three miles of those corridors, 87.4% of broadband serviceable locations already have service of at least 100/20 Mbps, and 90.4% either have it or are included in a BEAD project.
On August 7, 2026, the ACLP submitted comments to the Colorado Broadband Office on its Draft Middle Mile Due Diligence and Strategic Roadmap Report, drawing on the analysis below.
Key Takeaways
- Most locations near the proposed corridors already have service. Within three miles of a priority corridor, 87.4% of the 129,023 broadband serviceable locations can already get service of at least 100 Mbps download and 20 Mbps upload, excluding satellite and unlicensed fixed wireless.
- Counting BEAD, that share rises to 90.4%. Adding locations included in a future BEAD project, again excluding satellite and unlicensed fixed wireless, nine in ten locations within three miles of a corridor either have service today or are due to be served.
- The result holds at every distance tested. 89.5% already served at one mile, 87.4% at three, 86.8% at five, and 85.8% at ten. Widening the buffer does not surface a materially less-served population.
Colorado’s Draft Middle-Mile Plan
The Colorado Broadband Office has released a draft plan for building new middle-mile fiber in rural parts of the state. Middle mile is the long-haul fiber that carries traffic between local networks and the wider internet. It does not reach homes and businesses directly, but the networks that do depend on it. The draft plan focuses on three regions in western and southwestern Colorado, identifies stretches of state and federal highway where new fiber could be laid, and scores them to select a smaller set for construction. Five corridor groups are carried through to a cost estimate of roughly $31.6 million. This post measures the extent to which broadband service already exists along these priority corridors. Our goal is to highlight areas of potential overbuild, which is wasteful, and offer decision-makers opportunities to better target available funding to address real needs.
Corridor Map
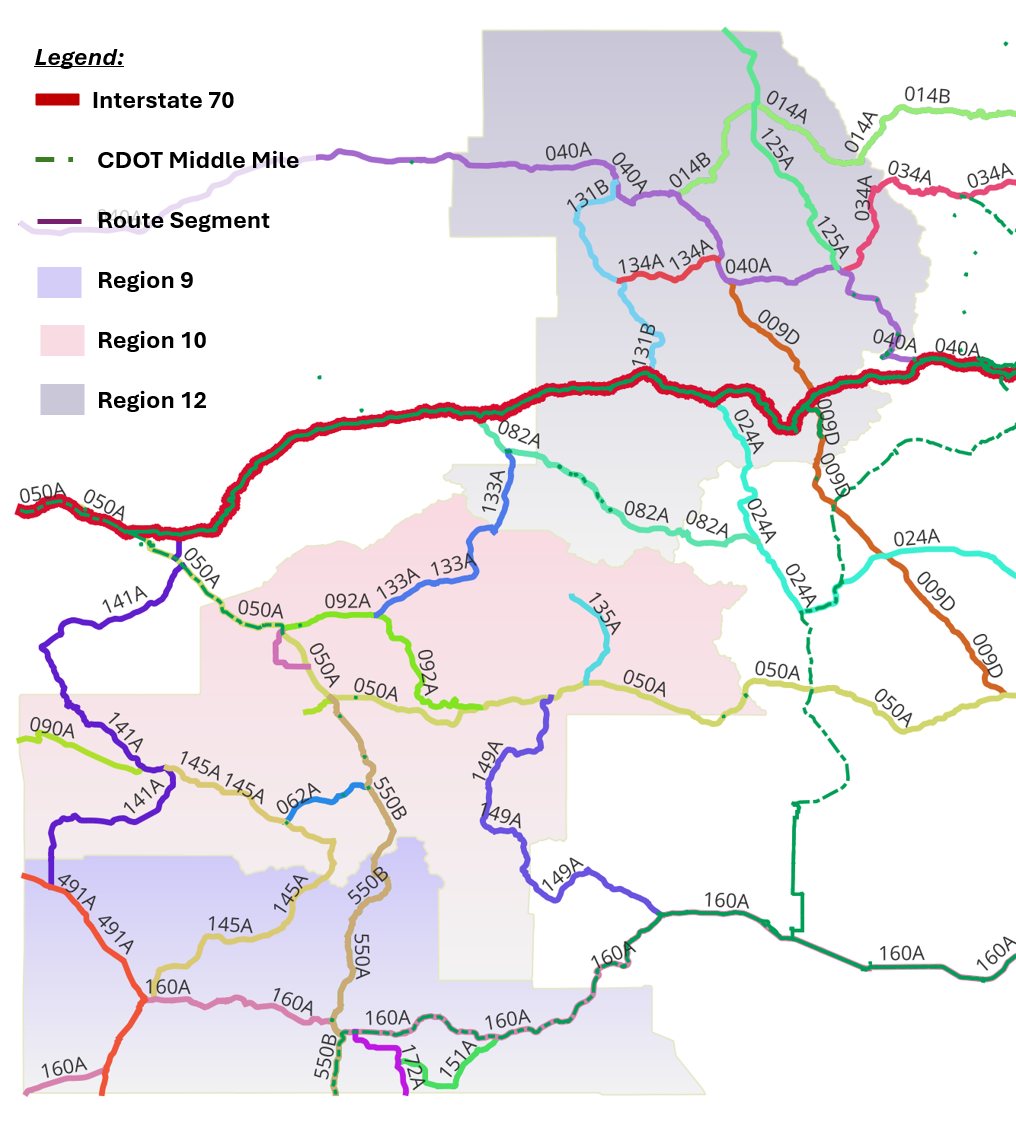
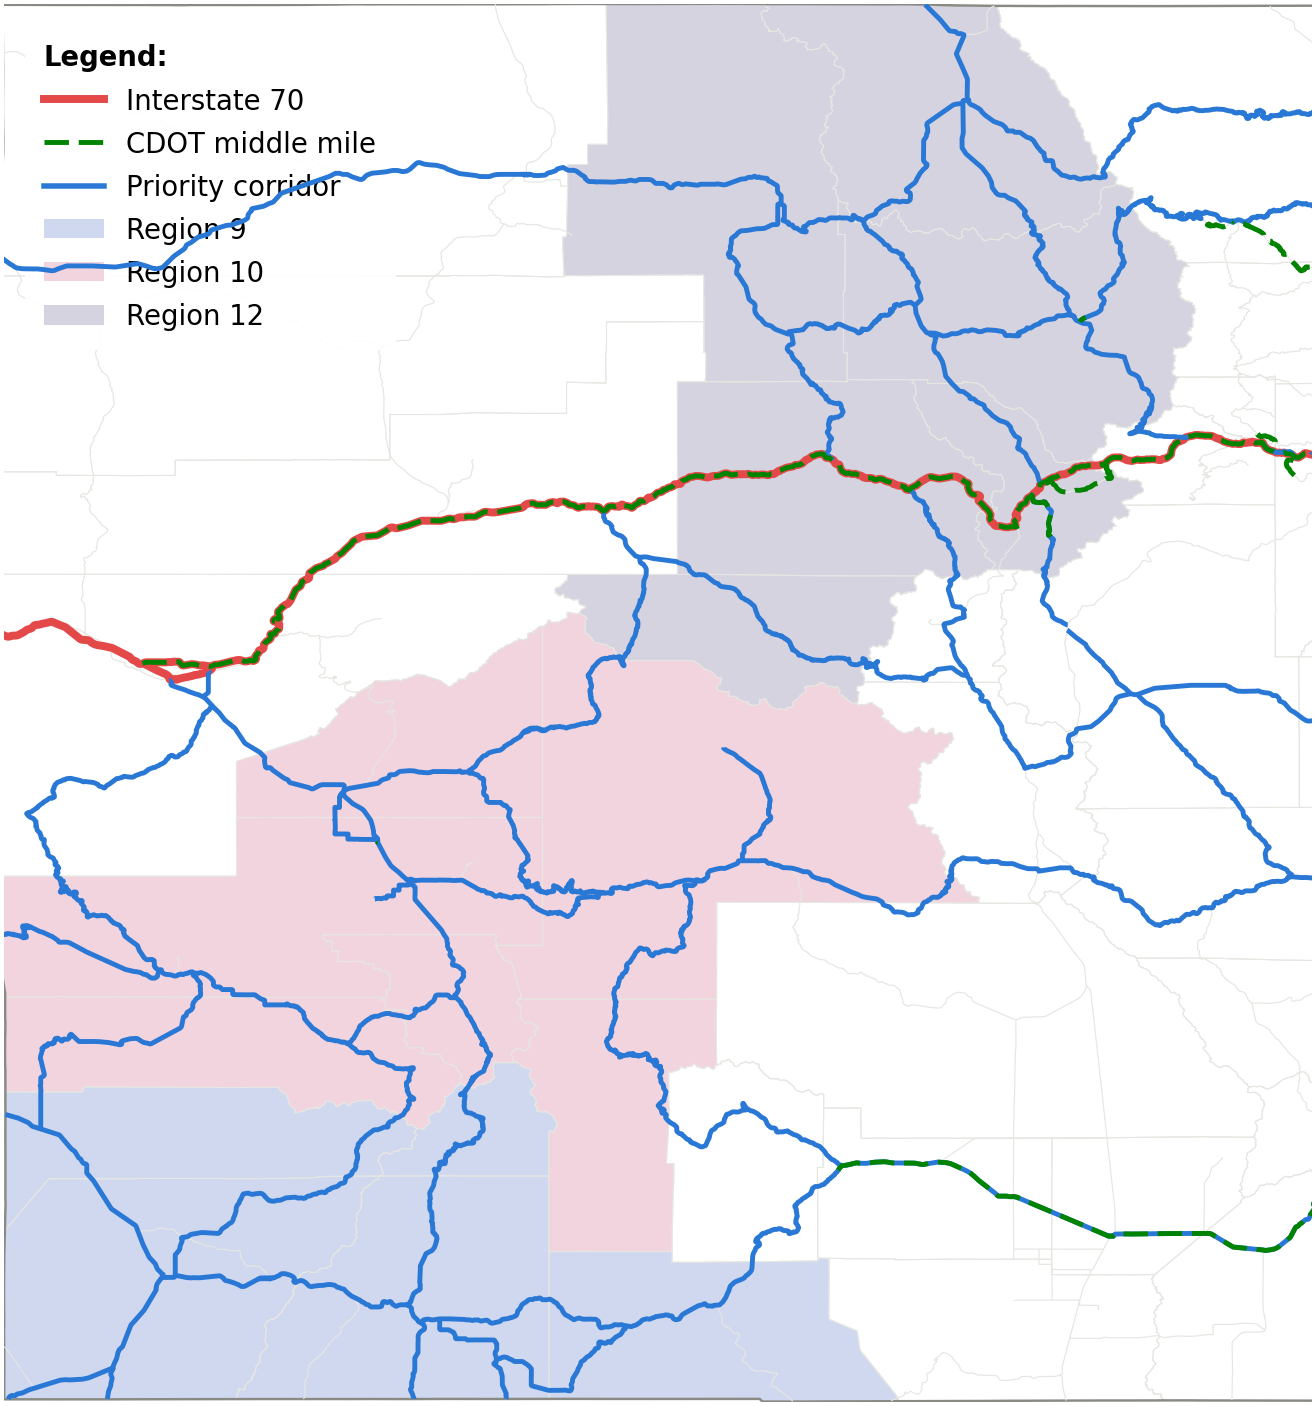
The Colorado Broadband Office’s draft middle-mile report identifies a set of priority corridors: stretches of state and federal highway where new middle-mile fiber could be built. Appendix B of the draft presents these corridors as a map, over a shaded background showing the three regions the study covers.
The map was reproduced from public data: CDOT’s published highway centerlines for the corridors, CDOT’s published record of which highways carry state fiber and between which mile markers for the fiber network, and Census county boundaries for the three regions. The corridor codes used in the draft are CDOT route identifiers, so each corridor maps directly to a published highway.
Proximity to Existing Service
For each priority corridor, every broadband serviceable location within a set distance of the route was identified, and the share where service of at least 100 Mbps download and 20 Mbps upload is already available was measured. Satellite and unlicensed fixed wireless are excluded. A second measure adds locations which are included in a future BEAD project (again excluding satellite and unlicensed fixed wireless). Locations come from the FCC’s location fabric, service from the FCC’s Broadband Data Collection as of December 2025, and awards from Colorado’s published BEAD data. Corridors are measured only within Regions 9, 10 and 12.
The table below gives the share of nearby locations where service is already available, at four distances. Within three miles of a corridor, 87.4% of locations already have service and 90.4% either have it or are included in a BEAD project.
The next table gives the same measures for all locations in each region, whether or not they are near a corridor. Across the three regions 84.8% of locations already have service. Region 9 is the least served at 79.6% and Region 12 the most at 88.3%.
| Area | Locations | Already served | Served or BEAD-funded |
|---|---|---|---|
| Region 9 | 50,316 | 79.6% | 84.8% |
| Region 10 | 55,104 | 84.8% | 85.7% |
| Region 12 | 73,317 | 88.3% | 90.5% |
| All three regions | 178,737 | 84.8% | 87.4% |
| Colorado | 2,002,901 | 93.1% | 94.8% |
The following table compares the five corridors selected for funding with the twenty that were not. Selected corridors are slightly less served today, 87.1% against 89.5%. Counting locations included in BEAD projects, the two groups are the same at 91.2%.
| Corridors | Locations | Already served | Served or BEAD-funded |
|---|---|---|---|
| Selected for funding | 57,252 | 87.1% | 91.2% |
| Not selected | 86,347 | 89.5% | 91.2% |
The final table breaks the three-mile figures out by corridor. Three of the five selected corridors are among the better served: 145A at 86.7%, 160A at 89.8% and 550B at 92.2%. The other two are the least served of the group, 149A at 40.3% and 062A at 59.3%. Several corridors that were not selected fall below most of those that were, including 151A at 52.5% and 131B at 73.9%.
| Corridor | Selected | Locations | Already served | Served or BEAD-funded |
|---|---|---|---|---|
| 160A | yes | 27,981 | 89.8% | 92.7% |
| 550B | yes | 27,578 | 92.2% | 95.5% |
| 050A | 23,437 | 95.8% | 95.9% | |
| 040A | 17,705 | 85.8% | 89.6% | |
| 145A | yes | 10,720 | 86.7% | 88.9% |
| 082A | 10,080 | 98.5% | 98.6% | |
| 092A | 8,092 | 98.7% | 98.7% | |
| 135A | 6,953 | 83.6% | 83.6% | |
| 348A | 6,654 | 99.9% | 99.9% | |
| 009D | 6,385 | 90.8% | 94.6% | |
| 133A | 6,132 | 94.6% | 94.6% | |
| 034A | 5,806 | 95.2% | 98.3% | |
| 131B | 4,754 | 73.8% | 73.8% | |
| 172A | 4,431 | 92.1% | 92.6% | |
| 024A | 2,430 | 88.7% | 88.7% | |
| 062A | yes | 2,034 | 59.3% | 67.2% |
| 151A | 2,012 | 52.5% | 59.0% | |
| 125A | 1,849 | 84.5% | 87.1% | |
| 141A | 1,434 | 83.6% | 83.6% | |
| 149A | yes | 1,391 | 40.3% | 64.6% |
| 014A | 741 | 74.8% | 85.4% | |
| 014B | 732 | 78.4% | 79.6% | |
| 090A | 540 | 78.9% | 78.9% | |
| 134A | 373 | 6.4% | 53.1% | |
| 491A | 8 | 0.0% | 0.0% |